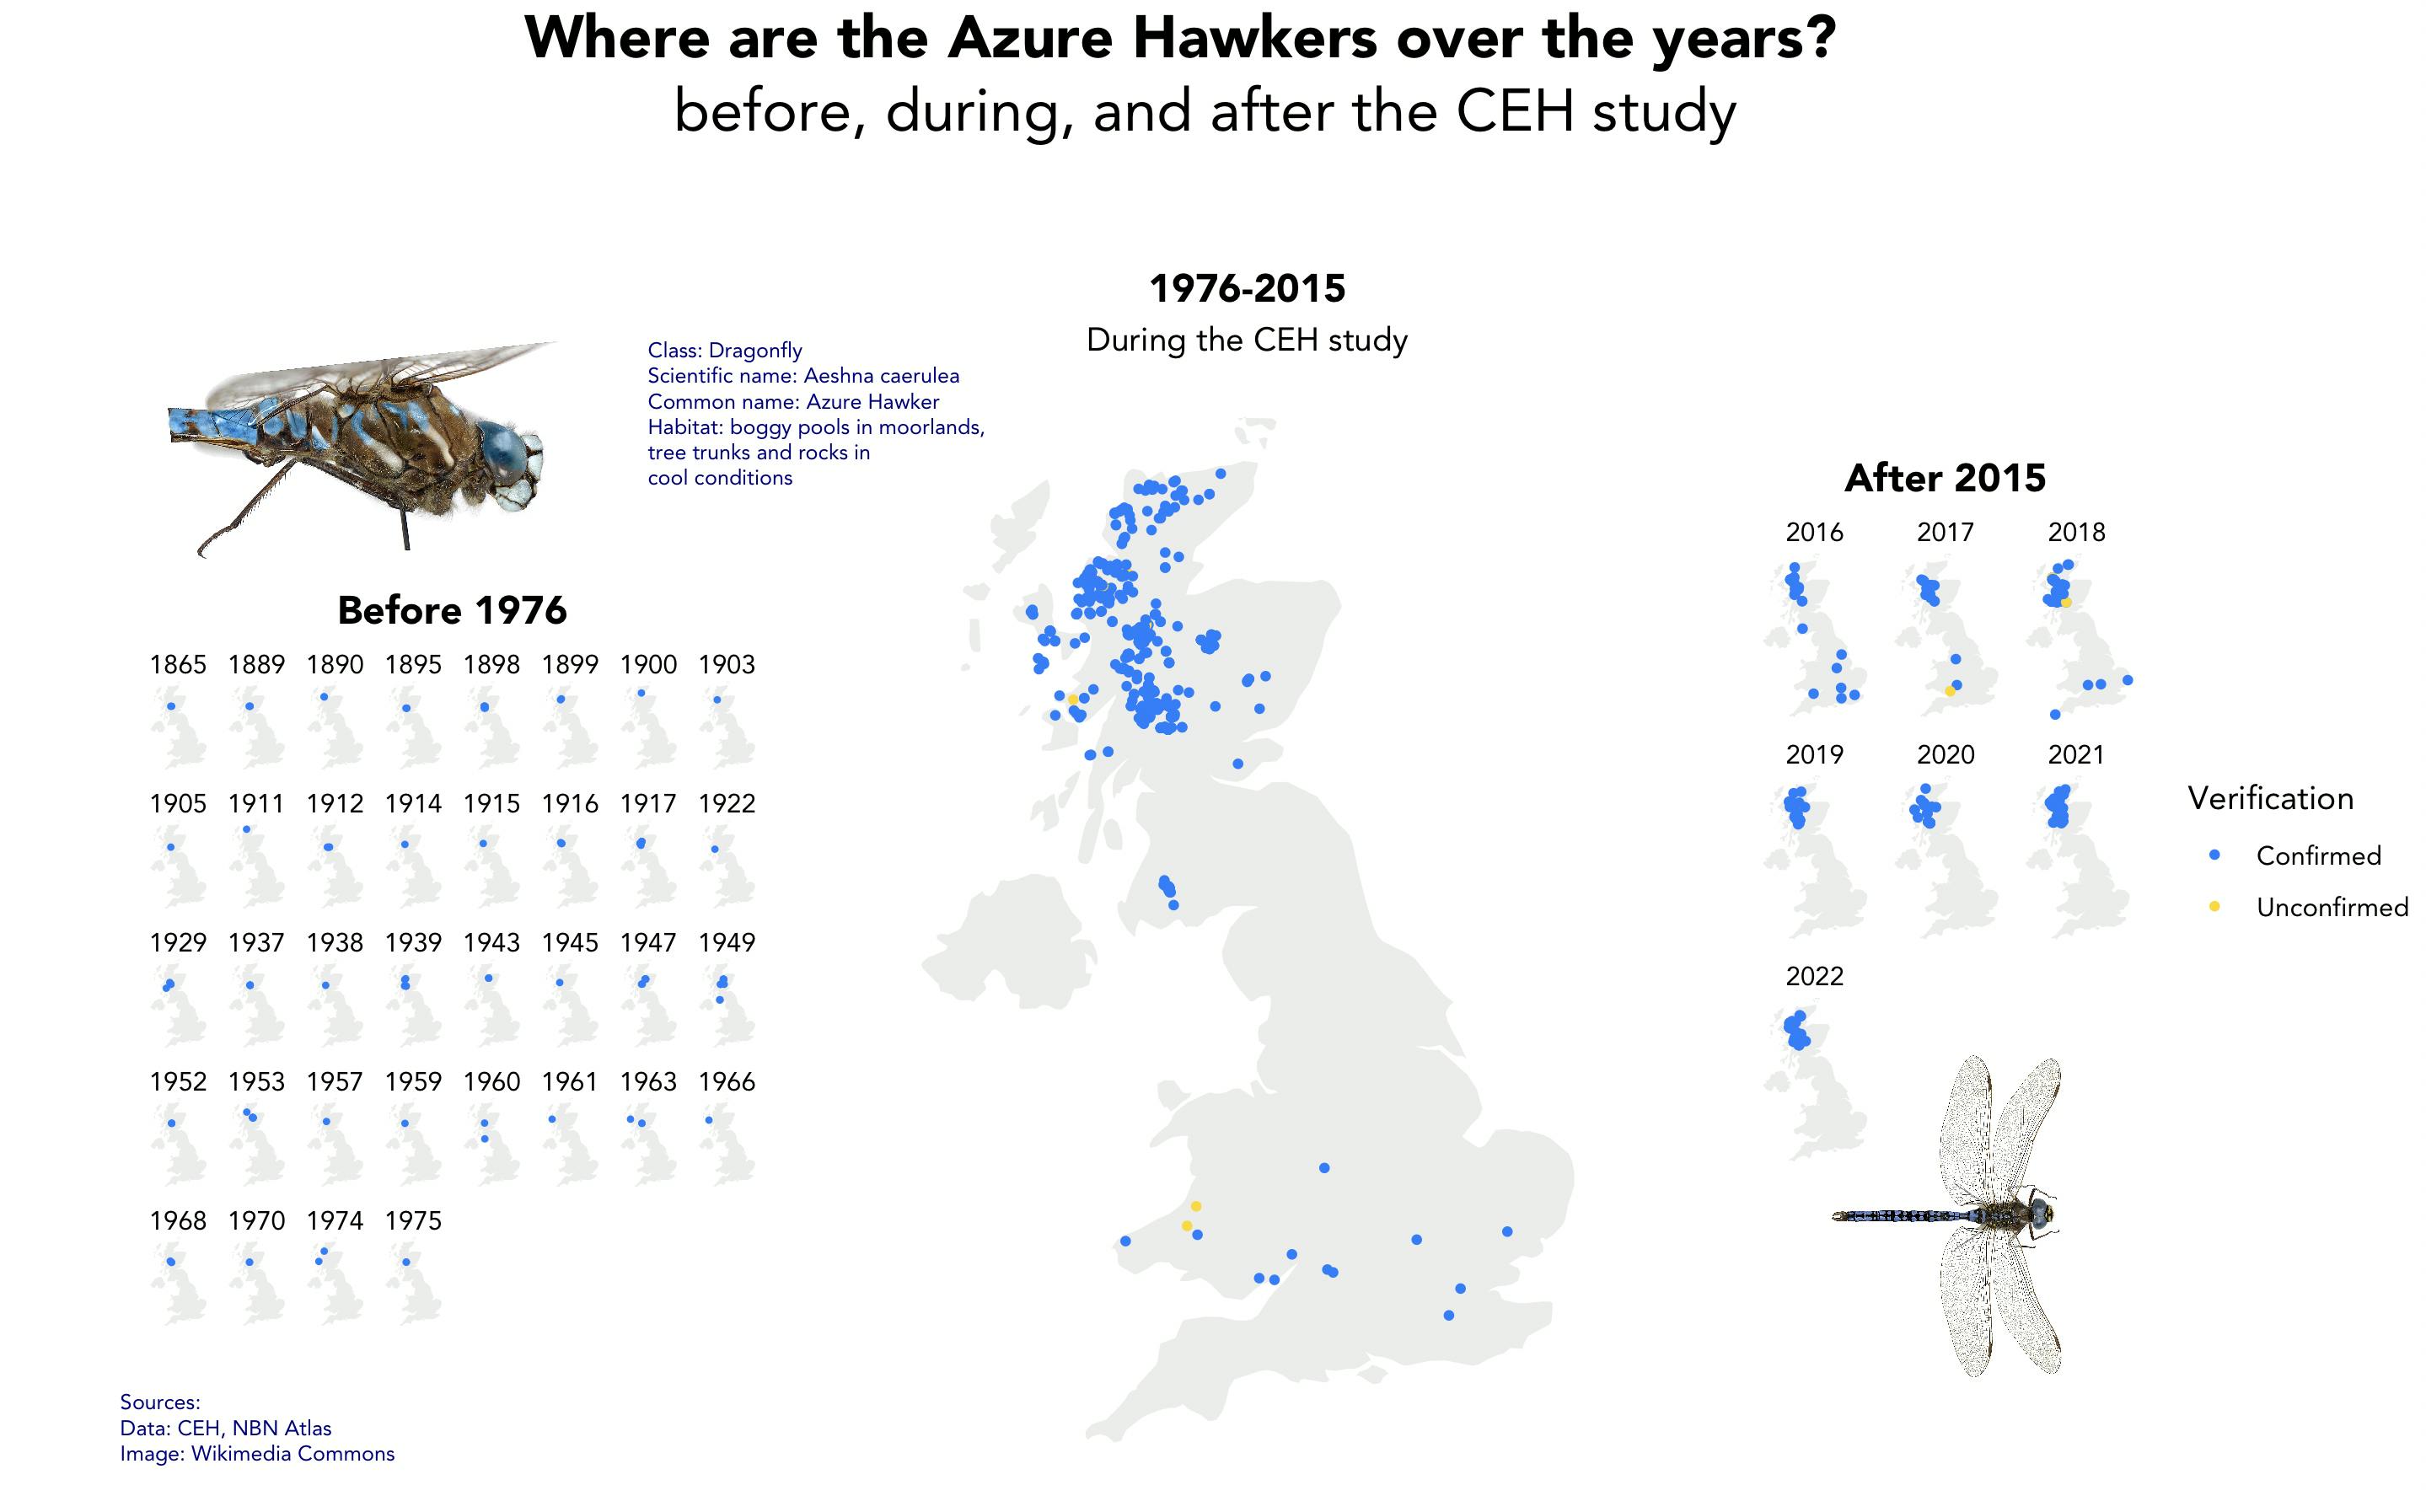
Complete Visualisation:

Tools used: R programming: ggplot, maps, patchwork libraries
Brief
This project uses the intersection of two studies to show the geographical biodiversity of the Aeshna Caerulea species over the years in the UK. The Aeshna Caerulea is one the small species of Dragonflies. It is also referred to as the Azure Hawker and is known to have distinctive Azure blue spots. This project considers the continuous study by the NBN Atlas and that of the CEH Study to show where multiple species were studied from 1976 to 2015. The figure below shows the metamorphosis of the entire project.

Metamorphosis of the Visual
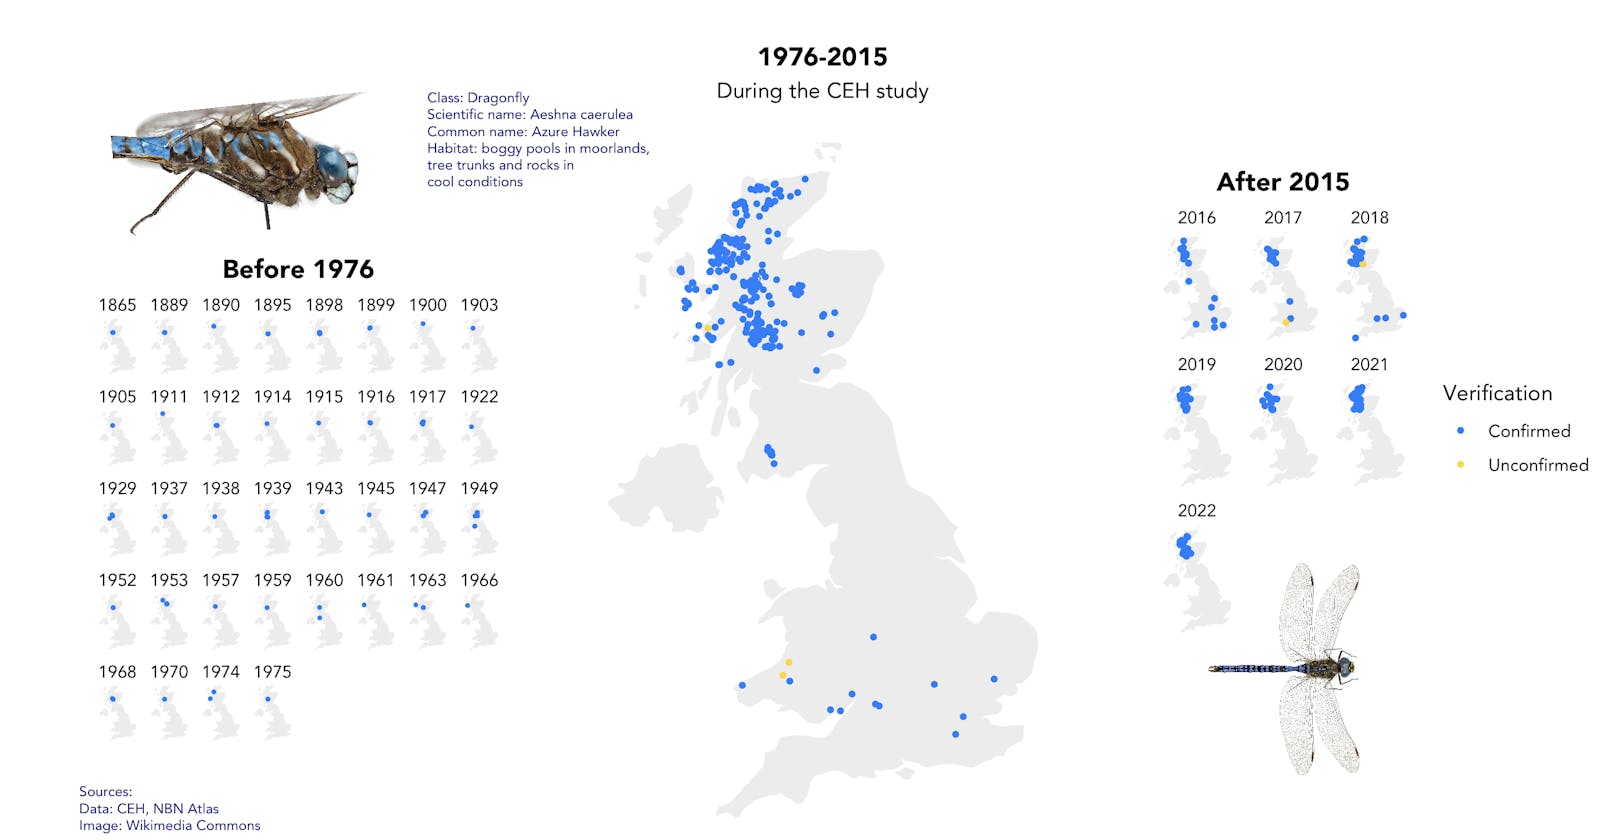
The move from each stage to the next was informed by engaging the audience. Specifically, the transition from stage 4 to stage 5 was to create signposting to create the narrative arc (setup, conflict and resolution). Stages 2 to 3 focus on adding sufficient illustrative elements (pictures and annotations) given that audience are non-scientific members of the public. A critical part of creating the visualisation was engaging the audience and making changes based on the feedback.
This project uses aggregation and small multiples to express the Azure Hawkers' geographical distribution. Small multiples aid comparison by displaying charts side by side on the same scale. Additionally, the big map leverages aggregation to prevent the entire visualisation from being overcrowded, allowing the viewers to quickly compare the period before and after the CEH study while preserving the information in that period.
References
Outhwaite, C. L., Gregory, R. D., Chandler, R. E., Collen, B., & Isaac, N. J. (2020). Complex long-term biodiversity change among invertebrates, bryophytes and lichens. Nature Ecology & Evolution, 4(3), 384–392.
Roth, R. E. (2021). Cartographic Design as Visual Storytelling: Synthesis and Review of Map-Based Narratives, Genres, and Tropes. The Cartographic Journal, 58(1), 83–114. https://doi.org/10.1080/00087041.2019.1633103
